

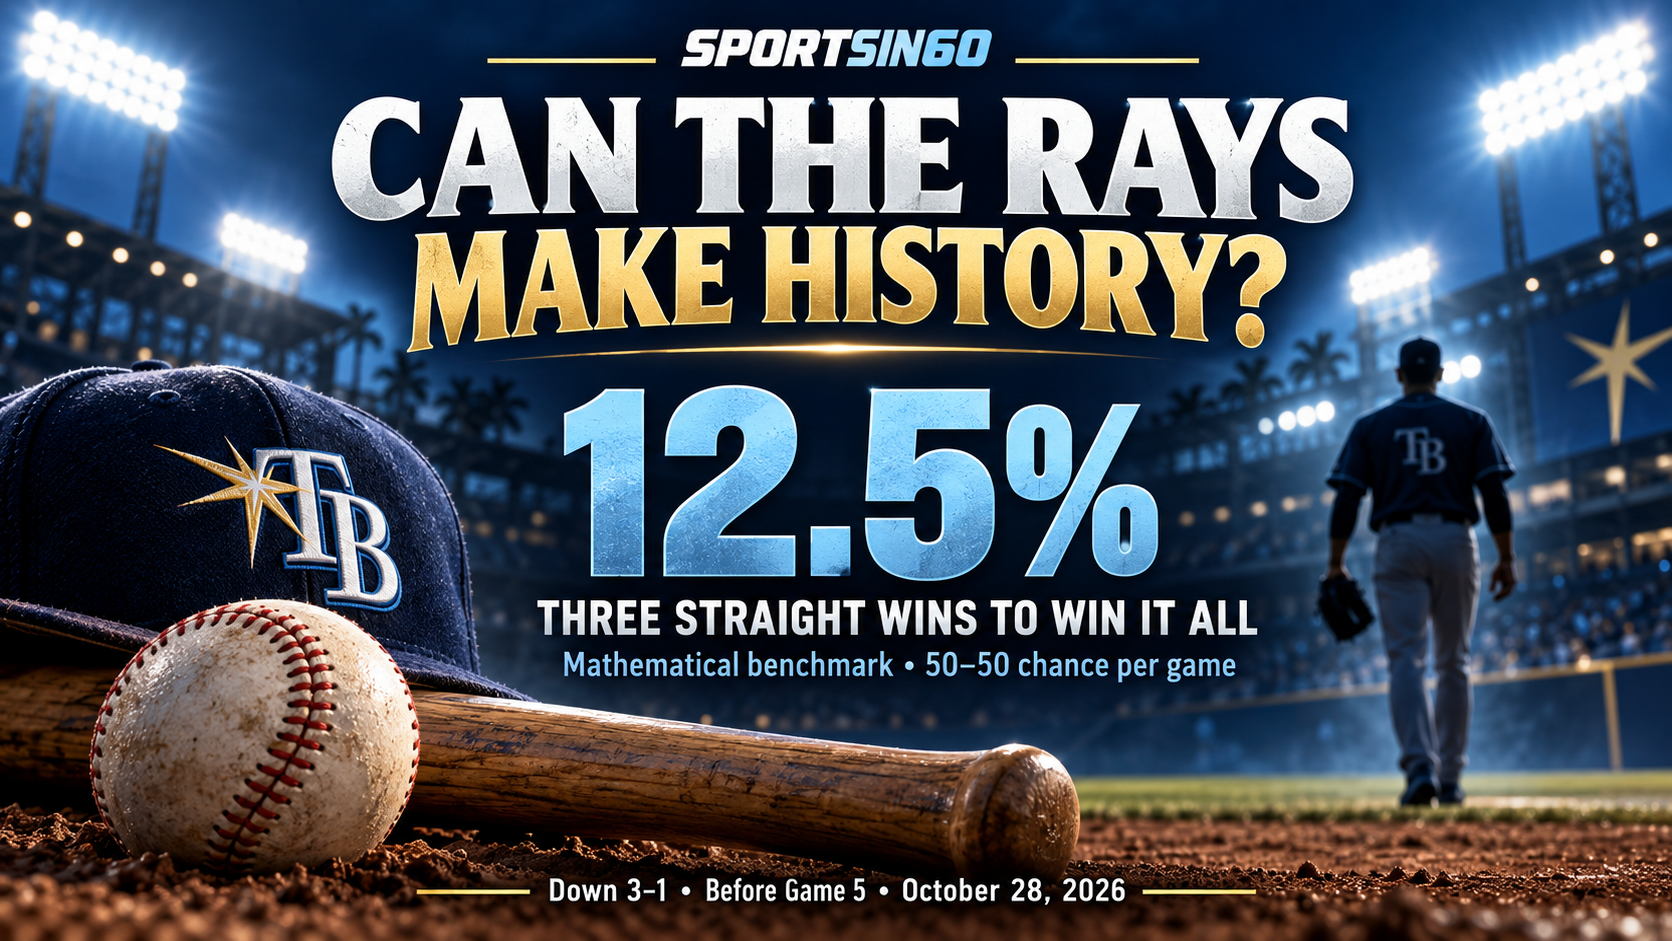
Can the Rays Complete a Historic World Series Comeback
Baseball in 60 ·
Tampa Bay has moved beyond the first step of its attempted escape.
The mathematics of surviving elimination and what the betting market can tell us
Tampa Bay has moved beyond the first step of its attempted escape. After falling behind Milwaukee three games to none, the Rays won Game 4, 4–3 in 12 innings. The series stood at 3–1 entering Game 5. This article uses that pre Game 5 snapshot on October 28 2026, rather than claiming to report a later live score. [1]
No team had completed a comeback from 0–3 in the World Series at that point. [2] That makes the Rays' opportunity historic. It does not make the probability zero. The useful questions are how many consecutive wins remain necessary, what chance Tampa Bay has in each game and how those chances combine.
There is an essential distinction in the original question. From 0–3, winning one game avoids a sweep, winning two forces Game 6 and winning three forces Game 7. Winning the championship requires four consecutive victories. From the present 1–3 position, the Rays need three more wins, with no further loss allowed.
The simple answer from the 3 to 1 position
Suppose, as a transparent starting model, Tampa Bay has a 50 percent chance in each remaining game. Under that assumption, its probability of winning Game 5 is 50 percent. Its probability of winning Games 5 and 6 is 25 percent. Its probability of winning Games 5, 6 and 7 is 12.5 percent.
| From 1 to 3 | Milestone reached | Model chance |
|---|---|---|
| One more win | Win Game 5 and force Game 6 | 50% |
| Two more wins | Win Games 5 and 6 and force Game 7 | 25% |
| Three more wins | Win Games 5 to 7 and the championship | 12.5% |
These are cumulative survival probabilities measured before Game 5. The chance of reaching the second milestone includes the need to pass the first. It is not a separate 25 percent chance that begins after Game 5 has already been won.
If Tampa Bay wins Game 5, the calculation changes. In the same equal-strength model, the title probability becomes 25 percent because only two wins remain. If it also wins Game 6, the title probability becomes 50 percent because only one game remains. The earlier victories are now observed results rather than future hurdles.
There is no contradiction between a 12.5 percent chance before Game 5 and a 50 percent chance after two more victories. Each successful elimination game removes one requirement. Conversely, a loss ends the title attempt immediately.
What the odds looked like from 0 to 3
Before Game 4, the same 50–50 model produced a 6.25 percent probability of four consecutive wins. That is one successful comeback per sixteen comparable attempts on average under the model, not a promise that every sixteenth team will succeed.
| From 0 to 3 | Milestone reached | Model chance |
|---|---|---|
| One consecutive win | Avoid the sweep | 50% |
| Two consecutive wins | Force Game 6 | 25% |
| Three consecutive wins | Force Game 7 | 12.5% |
| Four consecutive wins | Win the championship | 6.25% |
The historical statement and the mathematical statement answer different questions. History tells us what has happened in past World Series. The model tells us what would happen over repeated hypothetical series with specified game probabilities. A model can assign a positive chance to an event that has not yet appeared in a limited historical sample.
If independent fair coin tosses are the analogy, four heads in a row is uncommon but entirely possible. Baseball games are more complicated than coin tosses, so the analogy explains multiplication rather than establishing that the clubs are equally likely to win each contest.
Figure 1 Two starting positions and the remaining milestones
Why winning once does not mean the comeback is halfway complete
Emotionally, avoiding elimination can feel transformative. Mathematically, a victory changes the number of tasks remaining. It does not by itself prove that the team has become stronger or that its next opponent has become weaker.
In the equal-strength model, the jump from 6.25 percent before Game 4 to 12.5 percent after winning it is a doubling. That sounds dramatic, and it is a meaningful improvement. It still leaves an 87.5 percent chance of failing to complete the comeback under those assumptions.
A fair description should report both the improvement and the remaining difficulty. Tampa Bay has removed one obstacle. It must still win every remaining game, while Milwaukee needs only one victory to end the series.
This asymmetry matters more than the emotional idea that momentum must now belong entirely to the trailing club. The leading team can lose again and remain alive. The trailing team cannot absorb a single further defeat.
The games do not have to be 50 to 50
The 12.5 percent figure is a benchmark, not a team-specific forecast. If Tampa Bay's chance in each game were 40 percent, its chance of three straight wins would be 6.4 percent. At 45 percent per game, it would be about 9.1 percent. At 55 percent, it would be about 16.6 percent.
| Assumed per game | Win next game | Win next two | Win next three |
|---|---|---|---|
| 40% | 40.0% | 16.0% | 6.4% |
| 45% | 45.0% | 20.2% | 9.1% |
| 50% | 50.0% | 25.0% | 12.5% |
| 55% | 55.0% | 30.3% | 16.6% |
| 60% | 60.0% | 36.0% | 21.6% |
Small differences in the probability of an individual game become more influential when several victories are required. A 45 percent team and a 55 percent team are only ten percentage points apart in a single game. Across three consecutive required wins, the probabilities are approximately 9.1 and 16.6 percent.
The probabilities also need not be identical. An illustrative 50 percent chance in Game 5, 45 percent in Game 6 and 55 percent in Game 7 gives 0.50 × 0.45 × 0.55 = 0.12375, or approximately 12.4 percent. Those numbers are examples selected to show the method; they are not assessments of the actual pitching matchups.
The correct way to handle changing conditions
Let p5 be the probability of winning Game 5. Let p6 be the probability of winning Game 6 conditional on having won Game 5. Let p7 be the probability of winning Game 7 conditional on winning both earlier games. The championship probability is p5 × p6 × p7.
Using conditional probabilities avoids requiring a claim that the games are completely independent. A difficult Game 5 can change bullpen availability for Game 6. An injury can change the lineup. A manager can alter a later pitching plan after seeing how earlier games unfold.
A serious forecast should therefore update after each game. It should also identify which information is known and which remains uncertain. Assigning precise probabilities to unconfirmed future matchups can create the appearance of accuracy without the underlying evidence.
The arithmetic is straightforward once the inputs are supplied. The difficult analytical work is estimating those inputs responsibly.
Winning at least one more is different from winning exactly one more
When fans ask whether Tampa Bay can win one more game, they usually mean surviving the next elimination game. That event includes every path that later reaches Game 6 or Game 7. It should not be confused with winning exactly one additional game and then being eliminated.
Under the 50–50 model, the possible endings from 1–3 have these probabilities: lose Game 5 with no further wins, 50 percent; win Game 5 then lose Game 6, 25 percent; win Games 5 and 6 then lose Game 7, 12.5 percent; win all three and take the title, 12.5 percent. The four mutually exclusive outcomes add to 100 percent.
A standard calculation for winning any three of four games would be inappropriate here. Tampa Bay does not have four games remaining from 1–3, and it cannot lose a game and continue. Elimination determines which sequences are possible.
History explains the scale of the challenge
Boston reversed 0–3 in the 2004 ALCS, rather than the World Series. [3] That example demonstrates why the competition must be identified correctly when discussing a baseball comeback record.
Historical frequencies can provide context, but they are not automatically the probability for this Tampa Bay team. Past trailing clubs had different talent, opponents, pitching rotations and venues. The historical sample also selects teams that have already lost three games, which may reveal something about relative strength or circumstances.
A statistical analysis should not turn zero recorded World Series successes into proof of impossibility. Nor should it ignore the record and announce that a fair-coin model must be the truth. The useful approach presents history, a transparent mathematical benchmark and any team-specific forecast as distinct kinds of evidence.
What a Rays forecast should examine
Starting pitching matters because each game can present a different contest. The relevant question is the likely performance of the available pitchers against the opposing lineup, not simply whether a famous name is scheduled. Confirmed availability and recent workload matter as well.
Bullpen usage can connect the games. Extra innings may preserve a season while consuming pitchers needed the following day. A forecast that assumes every relief option is fully rested can misrepresent the actual situation. The same applies to both clubs.
Venue changes the environment, including familiarity and the structure of the final innings. It should enter a model through evidence about the teams and setting rather than a blanket assumption that the home club always wins.
Lineup health, platoon choices and defensive substitutions can influence the matchup. Weather and park conditions can also matter. These inputs provide reasons to move away from 50 percent; a memorable speech or a dramatic ending alone does not tell us how large that adjustment should be.
A useful article should explain why an estimate changes. If the number moves from ten percent to fourteen percent, readers should know whether the cause is a confirmed pitching change, a revised model or simply a different market price.
What the betting odds mean
A betting price expresses the terms available in a market. It is not a guarantee of the event's true probability. Sportsbook margin, liquidity, information and customer demand can all affect the relationship between a posted price and a fair probability.
For positive American odds, the raw implied probability is 100 divided by the odds number plus 100. Thus +700 implies 12.5 percent, +900 implies 10 percent and +1500 implies 6.25 percent. These are mathematical conversions of hypothetical prices, not current offers to bet the Rays.
| American odds | Decimal odds | Raw implied probability |
|---|---|---|
| +700 | 8.0 | 12.5% |
| +900 | 10.0 | 10.0% |
| +1500 | 16.0 | 6.25% |
| +2400 | 25.0 | 4.0% |
When both sides of a market are available, their raw implied probabilities commonly sum to more than 100 percent. One simple adjustment divides each raw probability by their total. That normalization removes the displayed overround proportionally; it still does not establish the true sporting probability.
A long price is not automatically a good bet. Whether a price offers value depends on a defensible probability estimate exceeding the break-even probability after relevant costs. A dramatic historical narrative cannot establish that difference on its own.
A dated market snapshot is useful only when labelled
Covers reported a Polymarket snapshot on October 27, before Game 4, showing Tampa Bay at 4 percent and Milwaukee at 96 percent to win the series. This is a historical market snapshot from the 0–3 position, not a post Game 4 quote. [4]
Four percent corresponds arithmetically to decimal odds of 25.0, or positive American odds of +2400, before considering fees or trading mechanics. That conversion does not mean a sportsbook necessarily offered that exact price.
It is tempting to double the earlier 4 percent after one victory and call the new probability 8 percent. That would require additional assumptions. A series price combines several possible future conditions, and the next game was not necessarily priced at 50 percent. The correct response is to obtain a fresh comparable series market or rebuild the conditional game estimates.
The 4 percent snapshot and the 6.25 percent fair-coin benchmark can coexist. They come from different inputs. Neither should be silently substituted for the other, and neither should be labelled the Rays' current probability after the series state has changed.
Are many people wagering on the comeback
There are markets and published betting coverage, but the available public evidence does not establish how many people specifically bought a Rays championship comeback after the 0–3 deficit. No reliable count of those bettors or total amount wagered was verified for this article.
A public split for Game 4 or Game 5 would answer a different question: how activity in a particular reported sample was divided for that game's market. A single-game wager on Tampa Bay is not necessarily a wager on winning the World Series.
Ticket share means the proportion of reported bets. Handle share means the proportion of reported money. Neither identifies the number of unique people. One person may place several bets, and a small number of larger wagers can produce a high share of money without a large share of tickets.
Percentages also need a denominator and a defined source. Thirty percent of an unspecified sample cannot tell us whether hundreds or hundreds of thousands of wagers were involved. Data from one operator should not be represented as the entire betting market.
Prediction-market volume is different again. Trading turnover can include the same position changing hands repeatedly, including people selling rather than backing the comeback. Dollar volume is not interchangeable with the amount of new money committed by distinct Rays supporters.
For that reason, claims that everyone is backing Tampa Bay, that professional bettors are flooding the comeback or that a huge number of people have taken the long odds would require evidence beyond a price screen. The honest conclusion is narrower: comeback markets attract coverage, but the specific scale of wagering remains unverified here.
What would make the next win so important
From 1–3, another victory would reduce the task to two games. In the equal-strength benchmark, the title probability would rise from 12.5 to 25 percent. A further victory would produce a deciding game and a 50 percent benchmark.
Those improvements are conditional on survival. Before Game 5, the chance of reaching the deciding game remains only 25 percent in the same model. Readers should not confuse the possible reward after two wins with the probability of getting there.
The Rays' opportunity is unusual because the historical achievement and the next immediate task are different scales of the same story. The entire comeback requires perfection over the remaining schedule. The next game requires only one successful performance.
That is why one game at a time is a sensible competitive focus even though it is not a mathematical forecast. Players can concentrate on the next contest. Analysts should still show the full chain of outcomes required for the title.
The probability is small and changes with each result
The clear benchmark is 50 percent to win one more, 25 percent to win two straight and 12.5 percent to win three straight from the pre Game 5 position, if every remaining contest is genuinely 50–50. The corresponding championship probability from the original 0–3 position was 6.25 percent because four wins were needed.
The actual probability may differ, and a useful estimate must explain its matchup assumptions. History supplies the scale of the achievement. Mathematics explains how the remaining hurdles combine. Betting markets supply prices, while verified wagering data are needed to say how many people are paying to back the story.
Sources and research notes
Editorial snapshot October 28 2026 before Game 5 with Milwaukee leading 3 to 1. This article is not a live scoreboard. All probability tables and the chart are original calculations under stated assumptions. No team-specific forecast or current sportsbook recommendation is asserted. The cited October 27 market price is historical and must not be reused as a post Game 4 quote. No verified count of championship-comeback bettors or total amount wagered was available in the material reviewed. Source pages may update after this snapshot.
[1] FOX Sports October 28 2026 Rays Stay Alive Game 4 Takeaways. Read source
[2] MLB October 28 2026 Brewers Rays World Series Game 5 FAQ. Read source
[3] MLB The Best Comeback Attempts from Three Games to None Holes. Read source
[4] Covers snapshot dated October 27 2026 World Series Odds and Reported Polymarket Prices. Read source